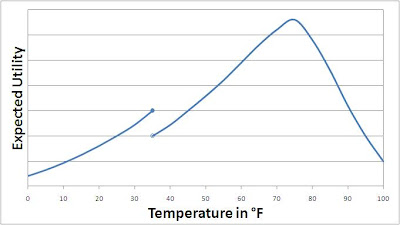
Below is a graph of my expected utility from weather based on the temperature. It includes things like chances of precipitation, wind, humidity, etc. It does not include the fact that Christmas is correlated with low temperatures. As with any utility function this is ordinal, not cardinal.

The jump discontinuity occurs where precipitation switches from being characterized by snow to rain. Rainy and 40 is way worse than snowing and 30. Luckily I believe I still did well on my exam tonight even though I spent some "study" time in the library drawing this on the board and thinking about it.

No comments:
Post a Comment